
Heatmaps and Attention Density in Python using Pupil Labs Eye Tracking
This guide explains how to turn gaze data exported from a Pupil Labs eye tracker into informative attention maps: you will visualize where attention accumulates over the panorama.
By the end, you will generate:
- An attention heatmap overlay on the panorama
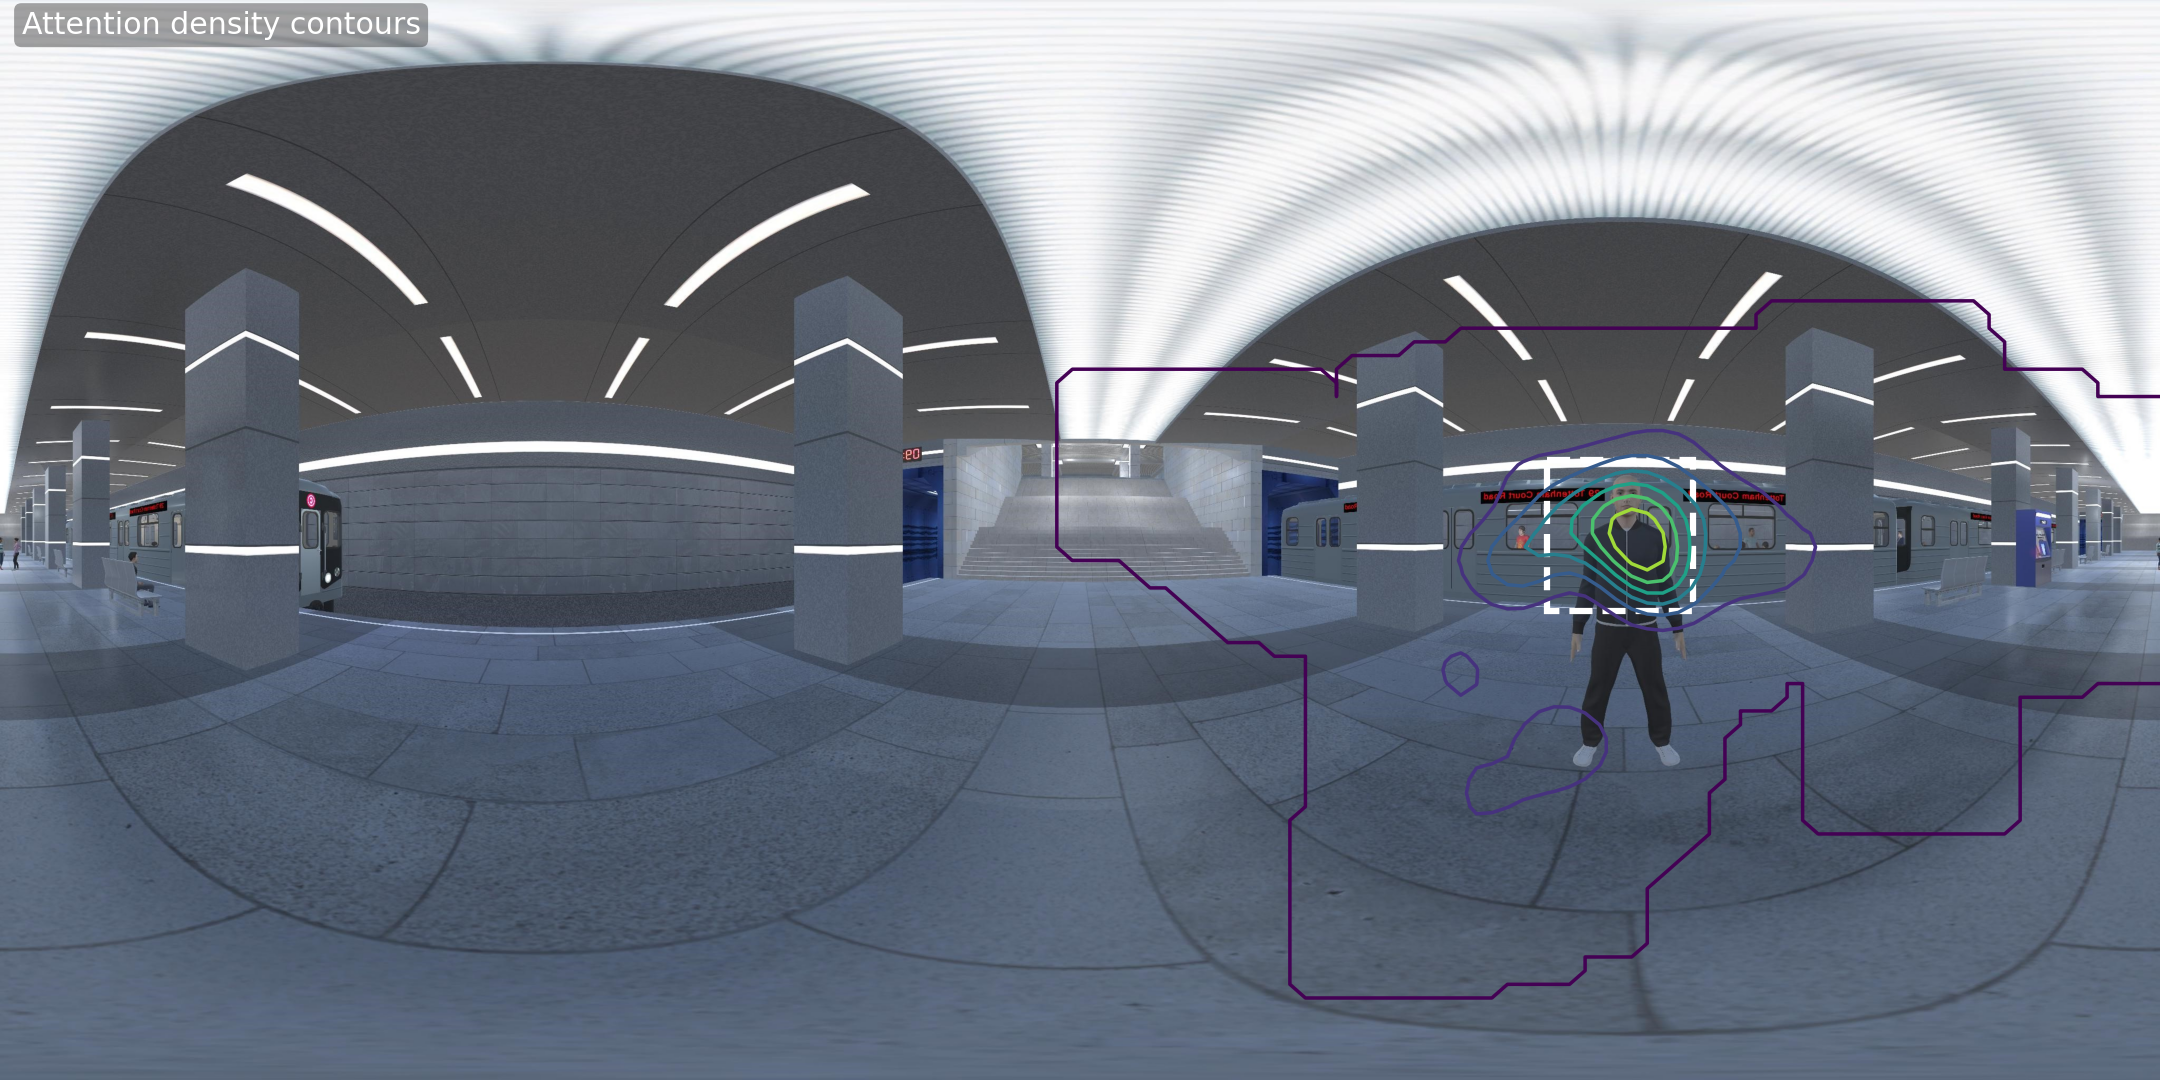
- Attention density contours that highlight hotspots
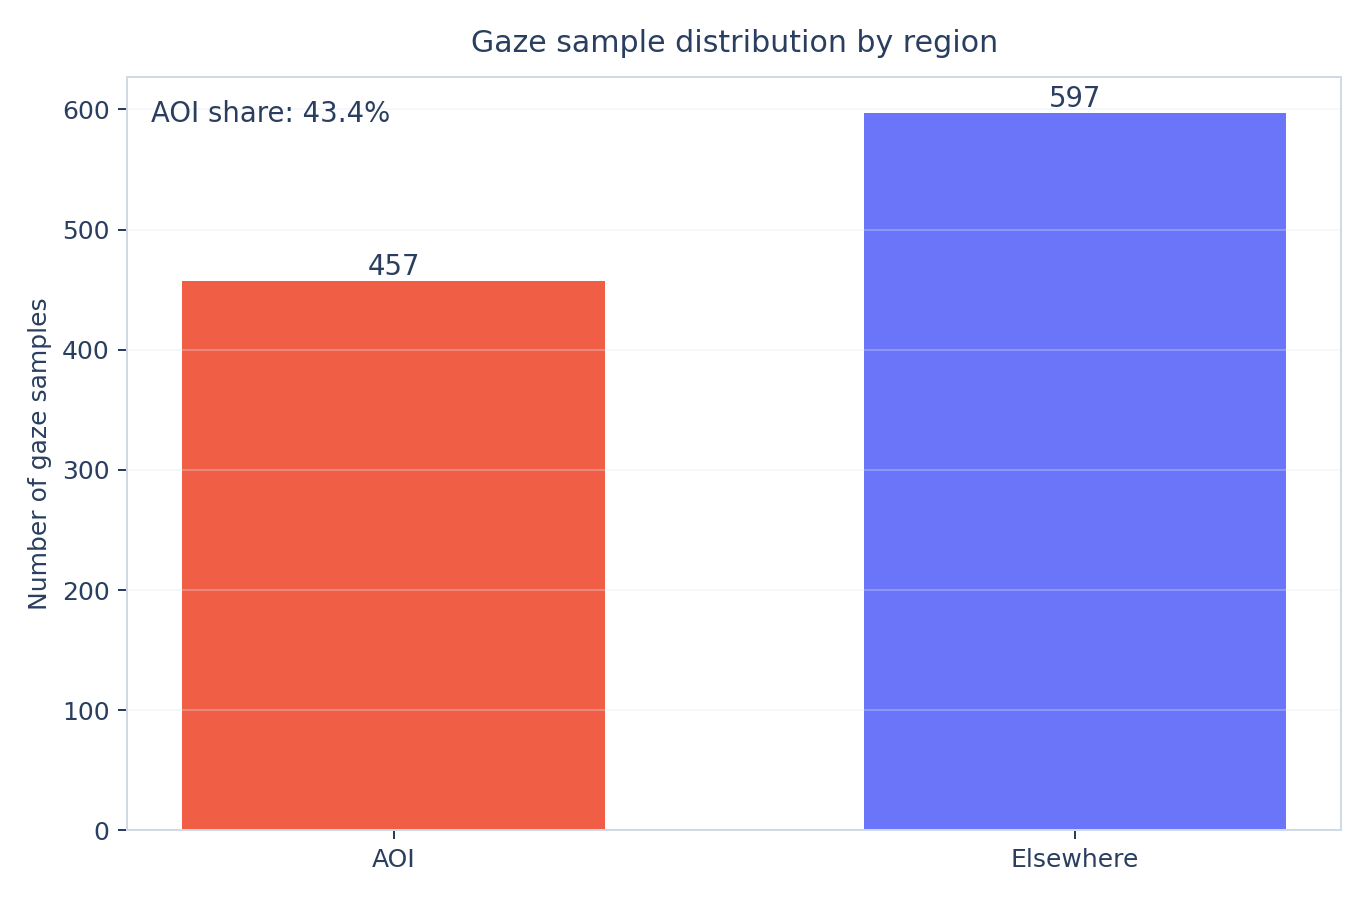
- An AOI attention summary chart
Note. This code works with Pupil Labs CSV exports (especially
Download Gaze Positions CSV File
Download Panorama Image
By the end, you will generate:
- An attention heatmap overlay on the panorama
- Attention density contours that highlight hotspots
- An AOI attention summary chart
Note. This code works with Pupil Labs CSV exports (especially
gaze_positions.csv). The code uses a panorama image captured in VRDownload Gaze Positions CSV File
Download Panorama Image
Requirements
- Anaconda Python Development Environment
- CSV files exported from Pupil Labs
- Optional panorama image (recommended for the most informative visualization)
- Python packages:
-
-
-
-
- CSV files exported from Pupil Labs
- Optional panorama image (recommended for the most informative visualization)
- Python packages:
-
pandas-
numpy-
matplotlib-
Pillow (usually included with Anaconda; used for reading images and writing image files)
Setup
1. Install Anaconda if needed.
2. Open Spyder, Jupyter Notebook, or VS Code.
3. Put the files in your working folder:
-
- optional: a panorama image file (for example, a panorama or screenshot)
4. Save the script as
To use Spyder, install Anaconda, run it, and launch Spyder. If you see Install instead of Launch for Spyder, install Spyder first. Create a new file in Spyder and save it in the same directory as your data when you run the examples below.
2. Open Spyder, Jupyter Notebook, or VS Code.
3. Put the files in your working folder:
-
gaze_positions.csv (required)- optional: a panorama image file (for example, a panorama or screenshot)
4. Save the script as
heatmap_attention_density.py in the same folder (or a folder of your choice and pass paths on the command line).To use Spyder, install Anaconda, run it, and launch Spyder. If you see Install instead of Launch for Spyder, install Spyder first. Create a new file in Spyder and save it in the same directory as your data when you run the examples below.
Step 1 Data
We start with gaze samples exported by Pupil Labs.
Important variables from
-
-
-
Important variables from
gaze_positions.csv: -
gaze_timestamp: sample timestamp (used to preserve temporal order) -
norm_pos_x, norm_pos_y: normalized gaze coordinates (used to place gaze samples on the panorama) -
confidence: sample confidence (used to optionally filter low-quality samples) Step 2 Build Attention Density and Plot Heatmaps
In this step, you:
1. Load
2. Filter low-confidence gaze samples
3. Convert
4. Build a 2D density map from gaze samples
5. Apply smoothing and plot attention visualizations
This turns noisy sample clouds into interpretable attention regions.
1. Load
gaze_positions.csv2. Filter low-confidence gaze samples
3. Convert
norm_pos_x and norm_pos_y into pixel coordinates on the panorama image4. Build a 2D density map from gaze samples
5. Apply smoothing and plot attention visualizations
This turns noisy sample clouds into interpretable attention regions.
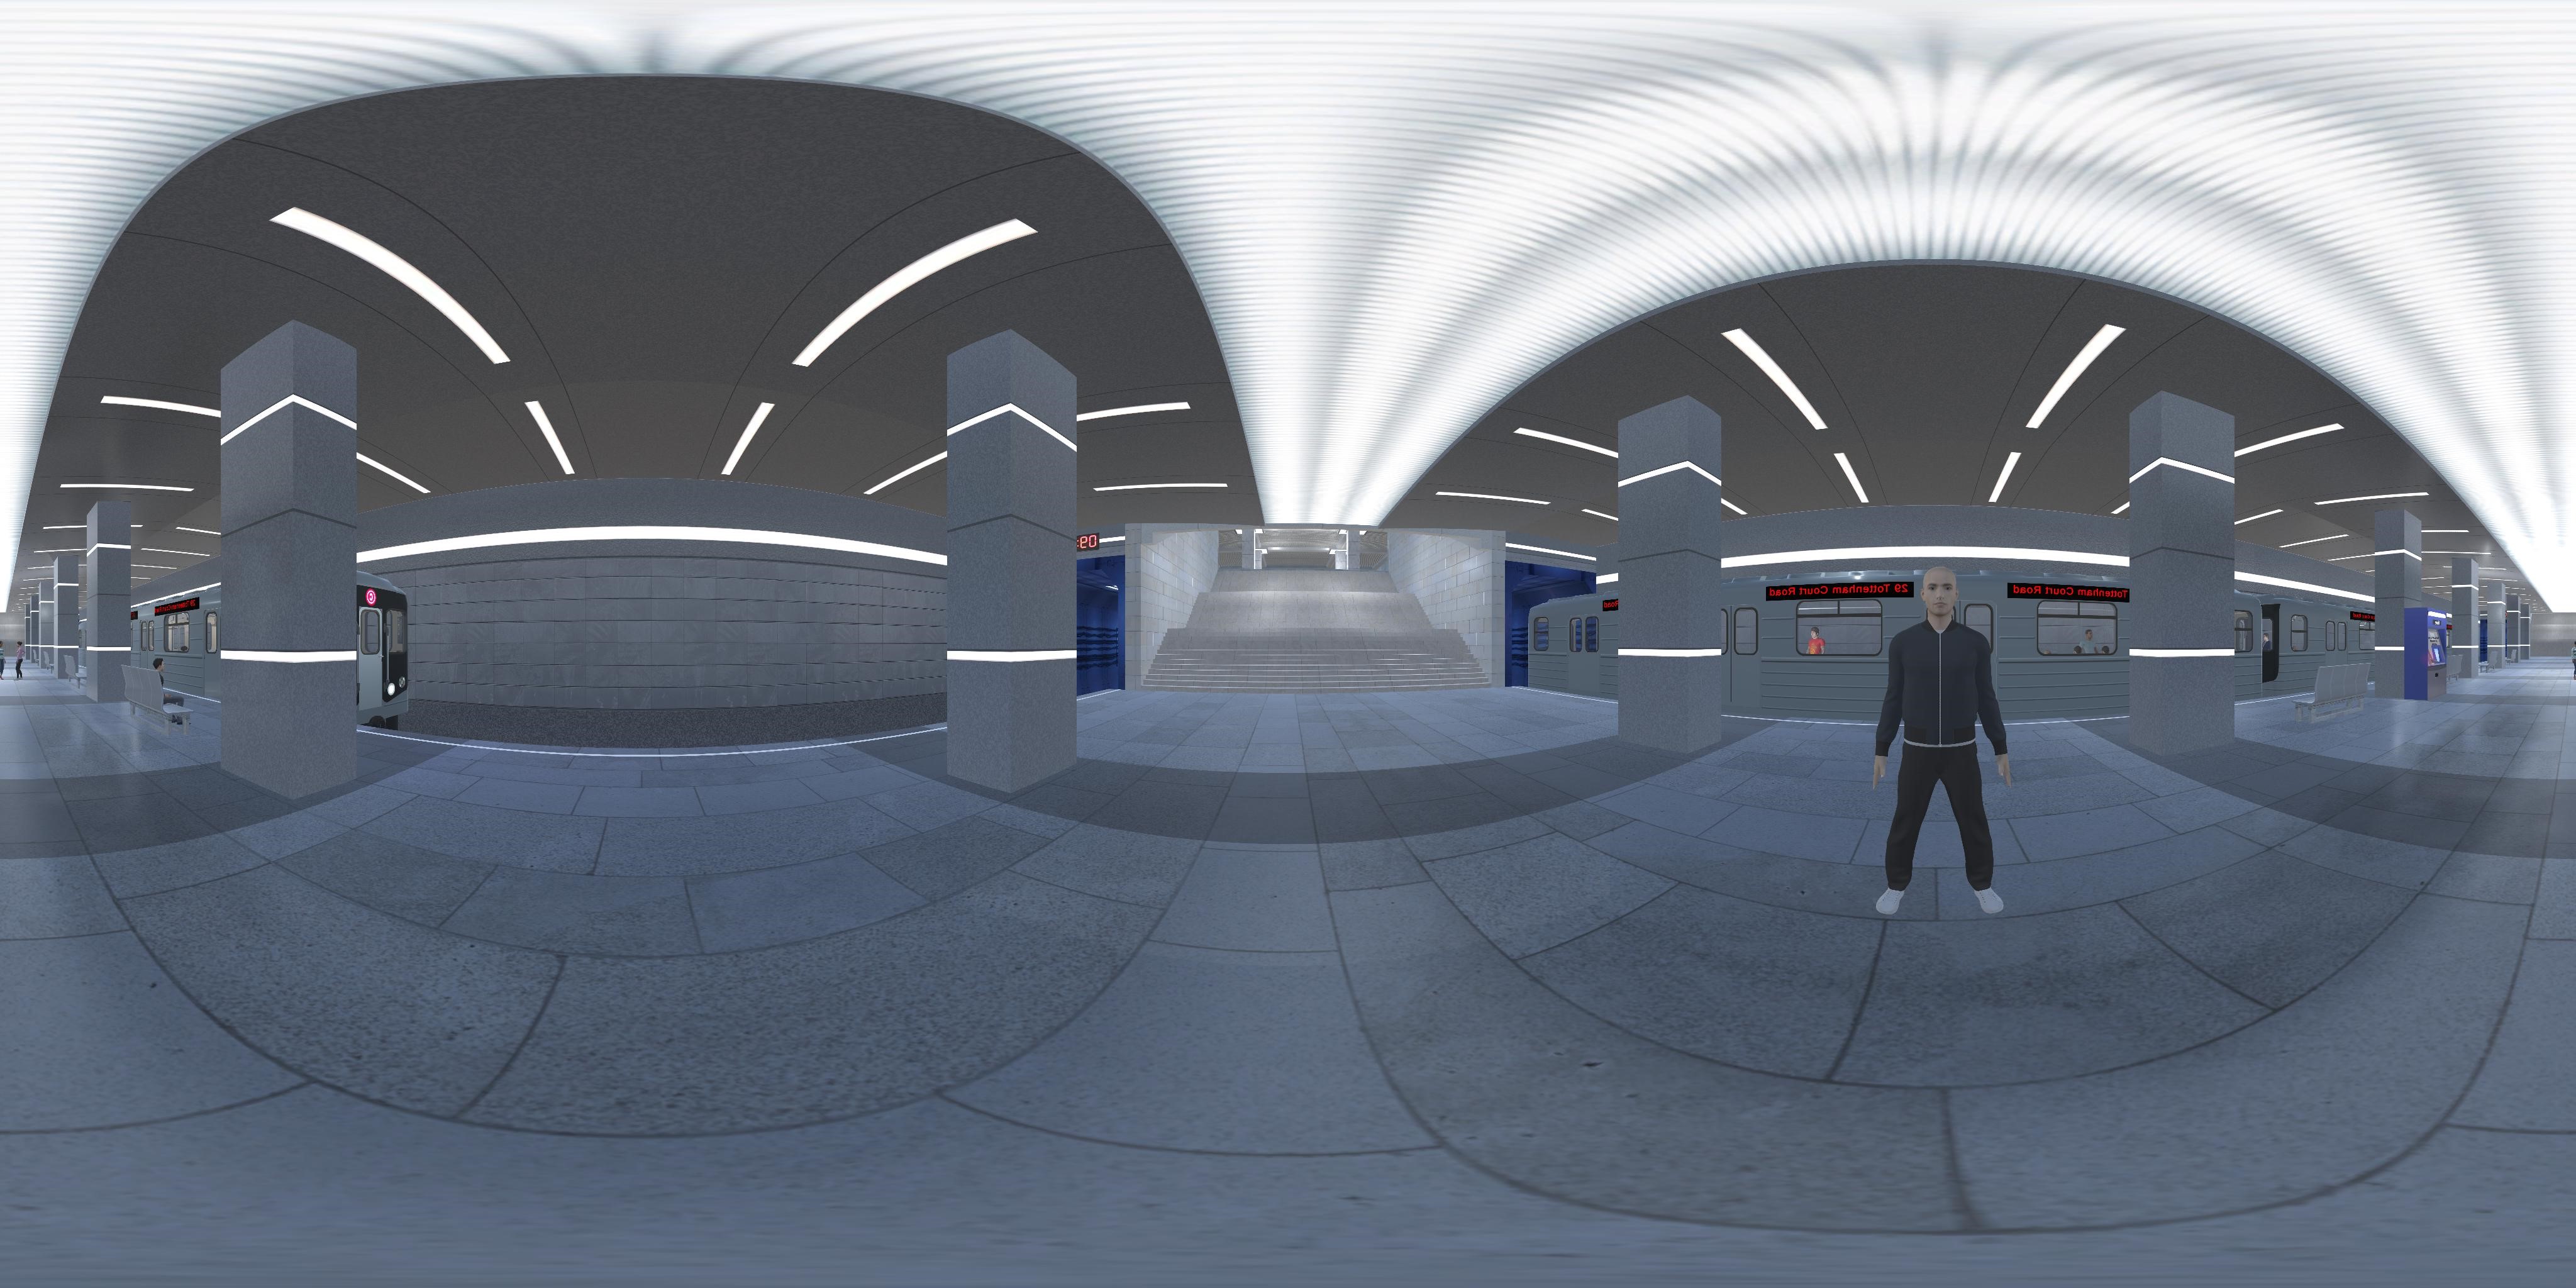
Panorama image and AOI definition
Download the panorama image for this tutorial provided above.
How this AOI was defined for the tutorial: The panorama used in the reference analysis is 4096 × 2048 pixels (width × height). The avatar region is a rectangle in pixel coordinates of the original image, with the origin at the top-left (x increases to the right, y increases downward): left = 885, right = 1162, top = 873, bottom = 1158. The script scales these numbers to match the actual width and height of your
Getting these coordinates in Adobe Illustrator: Open the image at full resolution and confirm the document size in pixels. Set Units to Pixels (for example Edit → Preferences → Units on Windows, or Illustrator → Settings → Units on Mac). Use the Rectangle Tool to draw a box over the region of interest. With the rectangle selected, read X, Y, W, and H in the Transform panel (or use Window → Info while adjusting the shape). Convert to left / right / top / bottom in pixels if needed (for example: right = left + width, bottom = top + height).
How this AOI was defined for the tutorial: The panorama used in the reference analysis is 4096 × 2048 pixels (width × height). The avatar region is a rectangle in pixel coordinates of the original image, with the origin at the top-left (x increases to the right, y increases downward): left = 885, right = 1162, top = 873, bottom = 1158. The script scales these numbers to match the actual width and height of your
--image file when you run it.Getting these coordinates in Adobe Illustrator: Open the image at full resolution and confirm the document size in pixels. Set Units to Pixels (for example Edit → Preferences → Units on Windows, or Illustrator → Settings → Units on Mac). Use the Rectangle Tool to draw a box over the region of interest. With the rectangle selected, read X, Y, W, and H in the Transform panel (or use Window → Info while adjusting the shape). Convert to left / right / top / bottom in pixels if needed (for example: right = left + width, bottom = top + height).
Step 2.1 Create an AOI-aware Attention Summary
In this step, you use the avatar AOI definition from the heatmap analysis to summarize regional attention:
1. Determine whether each gaze sample falls inside the avatar AOI rectangle
2. Overlay AOI boundaries on attention visualizations
3. Compare AOI sample count versus elsewhere sample count
4. Save an AOI summary plot (
Learning outcome: you can connect where attention accumulates with how much attention lands inside the AOI.
1. Determine whether each gaze sample falls inside the avatar AOI rectangle
2. Overlay AOI boundaries on attention visualizations
3. Compare AOI sample count versus elsewhere sample count
4. Save an AOI summary plot (
aoi_attention_summary.png)Learning outcome: you can connect where attention accumulates with how much attention lands inside the AOI.
Step 3 Generate Heatmap and Contour Outputs
1. Generate an attention heatmap over the panorama
2. Generate attention contours to highlight hotspots
3. Save output images for interpretation and reporting
If AOI mode is enabled, the AOI summary chart is generated as well.
2. Generate attention contours to highlight hotspots
3. Save output images for interpretation and reporting
If AOI mode is enabled, the AOI summary chart is generated as well.
Step 4 Run the Script
Option A (portable, minimal) — put
Option B (best visualization with an image overlay)
Option C (AOI-aware attention summary)
Expected output files (saved automatically to your
-
-
-
gaze_positions.csv in the same folder as the script and run:python heatmap_attention_density.py --gaze "gaze_positions.csv"Option B (best visualization with an image overlay)
python heatmap_attention_density.py --gaze "gaze_positions.csv" --image "panorama.jpg"Option C (AOI-aware attention summary)
python heatmap_attention_density.py --gaze "gaze_positions.csv" --image "panorama.jpg" --aoi-avatarExpected output files (saved automatically to your
outputs folder):-
attention_heatmap.png-
attention_contours.png-
aoi_attention_summary.png (only when --aoi-avatar is enabled)
Step 5 Code
Use the script file
heatmap_attention_density.py. The script uses gaze_timestamp for temporal ordering and norm_pos_x/norm_pos_y to map gaze samples onto the panorama and build attention-density visualizations.
"""
@author: Fjorda
"""
from __future__ import annotations
import argparse
from pathlib import Path
from typing import Tuple
import matplotlib.pyplot as plt
import numpy as np
import pandas as pd
from matplotlib.patches import Rectangle
IMG_W = 4096
IMG_H = 2048
# Avatar AOI rectangle in panorama pixel coordinates (original orientation)
AOI_X_LEFT = 2933
AOI_X_RIGHT = 3210
AOI_Y_TOP = 873
AOI_Y_BOTTOM = 1158
def parse_args():
script_dir = Path(__file__).resolve().parent
parser = argparse.ArgumentParser(
description="Create heatmap and attention-density visualizations from Pupil Labs gaze_positions.csv."
)
parser.add_argument("--gaze", type=Path, default=script_dir / "gaze_positions.csv", help="Path to gaze_positions.csv")
parser.add_argument("--image", type=Path, default=None, help="Optional stimulus image for overlay")
parser.add_argument("--out-dir", type=Path, default=script_dir / "outputs", help="Output directory")
parser.add_argument("--confidence-threshold", type=float, default=0.6, help="Minimum confidence")
parser.add_argument("--bins-x", type=int, default=140, help="Heatmap bins (x)")
parser.add_argument("--bins-y", type=int, default=80, help="Heatmap bins (y)")
parser.add_argument("--sigma", type=float, default=2.0, help="Smoothing sigma in bin units")
parser.add_argument("--aoi-avatar", action="store_true", help="Draw AOI and summarize AOI attention")
return parser.parse_args()
def gaussian_kernel1d(sigma: float) -> np.ndarray:
radius = max(1, int(round(3.0 * sigma)))
x = np.arange(-radius, radius + 1, dtype=float)
k = np.exp(-(x * x) / (2.0 * sigma * sigma))
k /= np.sum(k)
return k
def smooth2d(arr: np.ndarray, sigma: float) -> np.ndarray:
if sigma <= 0:
return arr
k = gaussian_kernel1d(sigma)
temp = np.apply_along_axis(lambda m: np.convolve(m, k, mode="same"), axis=1, arr=arr)
out = np.apply_along_axis(lambda m: np.convolve(m, k, mode="same"), axis=0, arr=temp)
return out
def load_gaze(path: Path, conf_thr: float) -> pd.DataFrame:
df = pd.read_csv(path)
required = {"gaze_timestamp", "norm_pos_x", "norm_pos_y"}
missing = required - set(df.columns)
if missing:
raise ValueError(f"Missing required columns: {sorted(missing)}")
cols = ["gaze_timestamp", "norm_pos_x", "norm_pos_y"]
if "confidence" in df.columns:
cols.append("confidence")
df = df[cols].dropna(subset=["gaze_timestamp", "norm_pos_x", "norm_pos_y"]).copy()
if "confidence" in df.columns:
df = df[df["confidence"] >= conf_thr].copy()
df["norm_pos_x"] = np.clip(df["norm_pos_x"].astype(float), 0.0, 1.0)
df["norm_pos_y"] = np.clip(df["norm_pos_y"].astype(float), 0.0, 1.0)
return df.sort_values("gaze_timestamp").reset_index(drop=True)
def aoi_calibration_shift(df: pd.DataFrame) -> Tuple[float, float]:
norm_x = df["norm_pos_x"].to_numpy(dtype=float)
norm_y_display = 1.0 - df["norm_pos_y"].to_numpy(dtype=float)
aoi_center_x = ((AOI_X_LEFT + AOI_X_RIGHT) / 2.0) / IMG_W
aoi_center_y = 1.0 - ((AOI_Y_TOP + AOI_Y_BOTTOM) / 2.0) / IMG_H
return aoi_center_x - float(np.median(norm_x)), aoi_center_y - float(np.median(norm_y_display))
def gaze_to_pixels(
df: pd.DataFrame,
W: int,
H: int,
shift_x: float = 0.0,
shift_y: float = 0.0,
) -> Tuple[np.ndarray, np.ndarray]:
x_norm = np.clip(df["norm_pos_x"].to_numpy(dtype=float) + shift_x, 0.0, 1.0)
y_norm = np.clip((1.0 - df["norm_pos_y"].to_numpy(dtype=float)) + shift_y, 0.0, 1.0)
x = x_norm * (W - 1)
y = y_norm * (H - 1)
return x, y
def build_density(x: np.ndarray, y: np.ndarray, W: int, H: int, bins_x: int, bins_y: int, sigma: float):
H2d, xedges, yedges = np.histogram2d(x, y, bins=[bins_x, bins_y], range=[[0, W], [0, H]])
D = smooth2d(H2d.T, sigma=sigma) # transpose for imshow orientation
return D, xedges, yedges
def draw_aoi(ax, W: int, H: int):
sx = W / IMG_W
sy = H / IMG_H
left = AOI_X_LEFT * sx
right = AOI_X_RIGHT * sx
top = AOI_Y_TOP * sy
bottom = AOI_Y_BOTTOM * sy
ax.add_patch(
Rectangle((left, top), right - left, bottom - top, fill=False, edgecolor="white", linewidth=2.5, linestyle="--")
)
def aoi_mask(x: np.ndarray, y: np.ndarray, W: int, H: int) -> np.ndarray:
sx = W / IMG_W
sy = H / IMG_H
left = AOI_X_LEFT * sx
right = AOI_X_RIGHT * sx
top = AOI_Y_TOP * sy
bottom = AOI_Y_BOTTOM * sy
return (x >= left) & (x <= right) & (y >= top) & (y <= bottom)
def plot_heatmap_overlay(img_arr: np.ndarray, D: np.ndarray, out_path: Path, with_aoi: bool):
H, W = img_arr.shape[0], img_arr.shape[1]
fig, ax = plt.subplots(figsize=(12, 7))
bg = img_arr[0, 0]
bg_rgb = tuple(float(c) / 255.0 for c in bg[:3]) if np.max(bg[:3]) > 1.0 else tuple(float(c) for c in bg[:3])
fig.patch.set_facecolor(bg_rgb)
ax.set_facecolor(bg_rgb)
fig.subplots_adjust(left=0, right=1, bottom=0, top=1)
ax.set_position([0, 0, 1, 1])
ax.imshow(img_arr)
vmax = np.percentile(D[D > 0], 98) if np.any(D > 0) else 1.0
ax.imshow(D, extent=[0, W, H, 0], cmap="inferno", alpha=0.55, vmin=0, vmax=vmax)
ax.text(
0.01, 0.99, "Attention heatmap overlay",
transform=ax.transAxes, color="white", fontsize=12, ha="left", va="top",
bbox=dict(facecolor="black", alpha=0.35, edgecolor="none", boxstyle="round,pad=0.25")
)
ax.set_axis_off()
if with_aoi:
draw_aoi(ax, W=W, H=H)
fig.savefig(out_path, dpi=180, bbox_inches="tight", pad_inches=0.0)
plt.close(fig)
def plot_density_contours(img_arr: np.ndarray, D: np.ndarray, out_path: Path, with_aoi: bool):
H, W = img_arr.shape[0], img_arr.shape[1]
fig, ax = plt.subplots(figsize=(12, 7))
bg = img_arr[0, 0]
bg_rgb = tuple(float(c) / 255.0 for c in bg[:3]) if np.max(bg[:3]) > 1.0 else tuple(float(c) for c in bg[:3])
fig.patch.set_facecolor(bg_rgb)
ax.set_facecolor(bg_rgb)
fig.subplots_adjust(left=0, right=1, bottom=0, top=1)
ax.set_position([0, 0, 1, 1])
ax.imshow(img_arr)
X = np.linspace(0, W, D.shape[1])
Y = np.linspace(0, H, D.shape[0])
levels = np.linspace(max(D.min(), 1e-12), max(D.max(), 1e-9), 8)
ax.contour(X, Y, D, levels=levels, cmap="viridis", linewidths=1.4)
if with_aoi:
draw_aoi(ax, W=W, H=H)
ax.text(
0.01, 0.99, "Attention density contours",
transform=ax.transAxes, color="white", fontsize=12, ha="left", va="top",
bbox=dict(facecolor="black", alpha=0.35, edgecolor="none", boxstyle="round,pad=0.25")
)
ax.set_axis_off()
fig.savefig(out_path, dpi=180, bbox_inches="tight", pad_inches=0.0)
plt.close(fig)
def plot_aoi_summary(mask: np.ndarray, out_path: Path):
in_count = int(np.sum(mask))
out_count = int(mask.size - in_count)
fig, ax = plt.subplots(figsize=(7.6, 5.0))
fig.patch.set_facecolor("white")
ax.set_facecolor("white")
bars = ax.bar(["AOI", "Elsewhere"], [in_count, out_count], color=["#EF553B", "#636EFA"], alpha=0.95, width=0.62)
total = max(1, in_count + out_count)
for b in bars:
h = b.get_height()
ax.text(b.get_x() + b.get_width() / 2.0, h, f"{int(h):,}", ha="center", va="bottom", color="#2a3f5f", fontsize=11)
ax.set_title("Gaze sample distribution by region", color="#2a3f5f", pad=10)
ax.set_ylabel("Number of gaze samples", color="#2a3f5f")
ax.tick_params(axis="x", colors="#2a3f5f")
ax.tick_params(axis="y", colors="#2a3f5f")
ax.text(
0.02,
0.97,
f"AOI share: {100.0*in_count/total:.1f}%",
transform=ax.transAxes,
ha="left",
va="top",
color="#2a3f5f",
fontsize=11,
)
ax.grid(axis="y", alpha=0.3, color="#dfe8f3", linestyle="-")
for spine in ax.spines.values():
spine.set_color("#d0d9e6")
fig.tight_layout()
fig.savefig(out_path, dpi=180)
plt.close(fig)
def main():
args = parse_args()
gaze_path = args.gaze.expanduser().resolve()
out_dir = args.out_dir.expanduser().resolve()
out_dir.mkdir(parents=True, exist_ok=True)
if not gaze_path.exists():
raise FileNotFoundError(f"Missing gaze file: {gaze_path}")
df = load_gaze(gaze_path, conf_thr=args.confidence_threshold)
if args.image is not None:
from PIL import Image
image_path = args.image.expanduser().resolve()
if not image_path.exists():
raise FileNotFoundError(f"Missing image file: {image_path}")
img_arr = np.asarray(Image.open(image_path))
H, W = img_arr.shape[0], img_arr.shape[1]
else:
W, H = IMG_W, IMG_H
img_arr = np.zeros((H, W, 3), dtype=np.uint8)
shift_x, shift_y = (0.0, 0.0)
if args.aoi_avatar:
# Keep AOI overlays and AOI counts pedagogically meaningful for this scene.
shift_x, shift_y = aoi_calibration_shift(df)
x, y = gaze_to_pixels(df, W=W, H=H, shift_x=shift_x, shift_y=shift_y)
D, _, _ = build_density(x, y, W=W, H=H, bins_x=args.bins_x, bins_y=args.bins_y, sigma=args.sigma)
plot_heatmap_overlay(
img_arr=img_arr,
D=D,
out_path=out_dir / "attention_heatmap.png",
with_aoi=args.aoi_avatar,
)
plot_density_contours(
img_arr=img_arr,
D=D,
out_path=out_dir / "attention_contours.png",
with_aoi=args.aoi_avatar,
)
if args.aoi_avatar:
mask = aoi_mask(x, y, W=W, H=H)
plot_aoi_summary(mask=mask, out_path=out_dir / "aoi_attention_summary.png")
print(f"AOI samples: {int(mask.sum()):,} / {len(mask):,}")
print(f"Gaze samples used: {len(df):,}")
print(f"Outputs saved to: {out_dir}")
if __name__ == "__main__":
main()
After you run the script with
--image (and optionally --aoi-avatar), you will obtain the heatmap outputs listed in Step 4. Example figures below use the same image paths as on this site (you can replace them with your generated plots when you upload assets).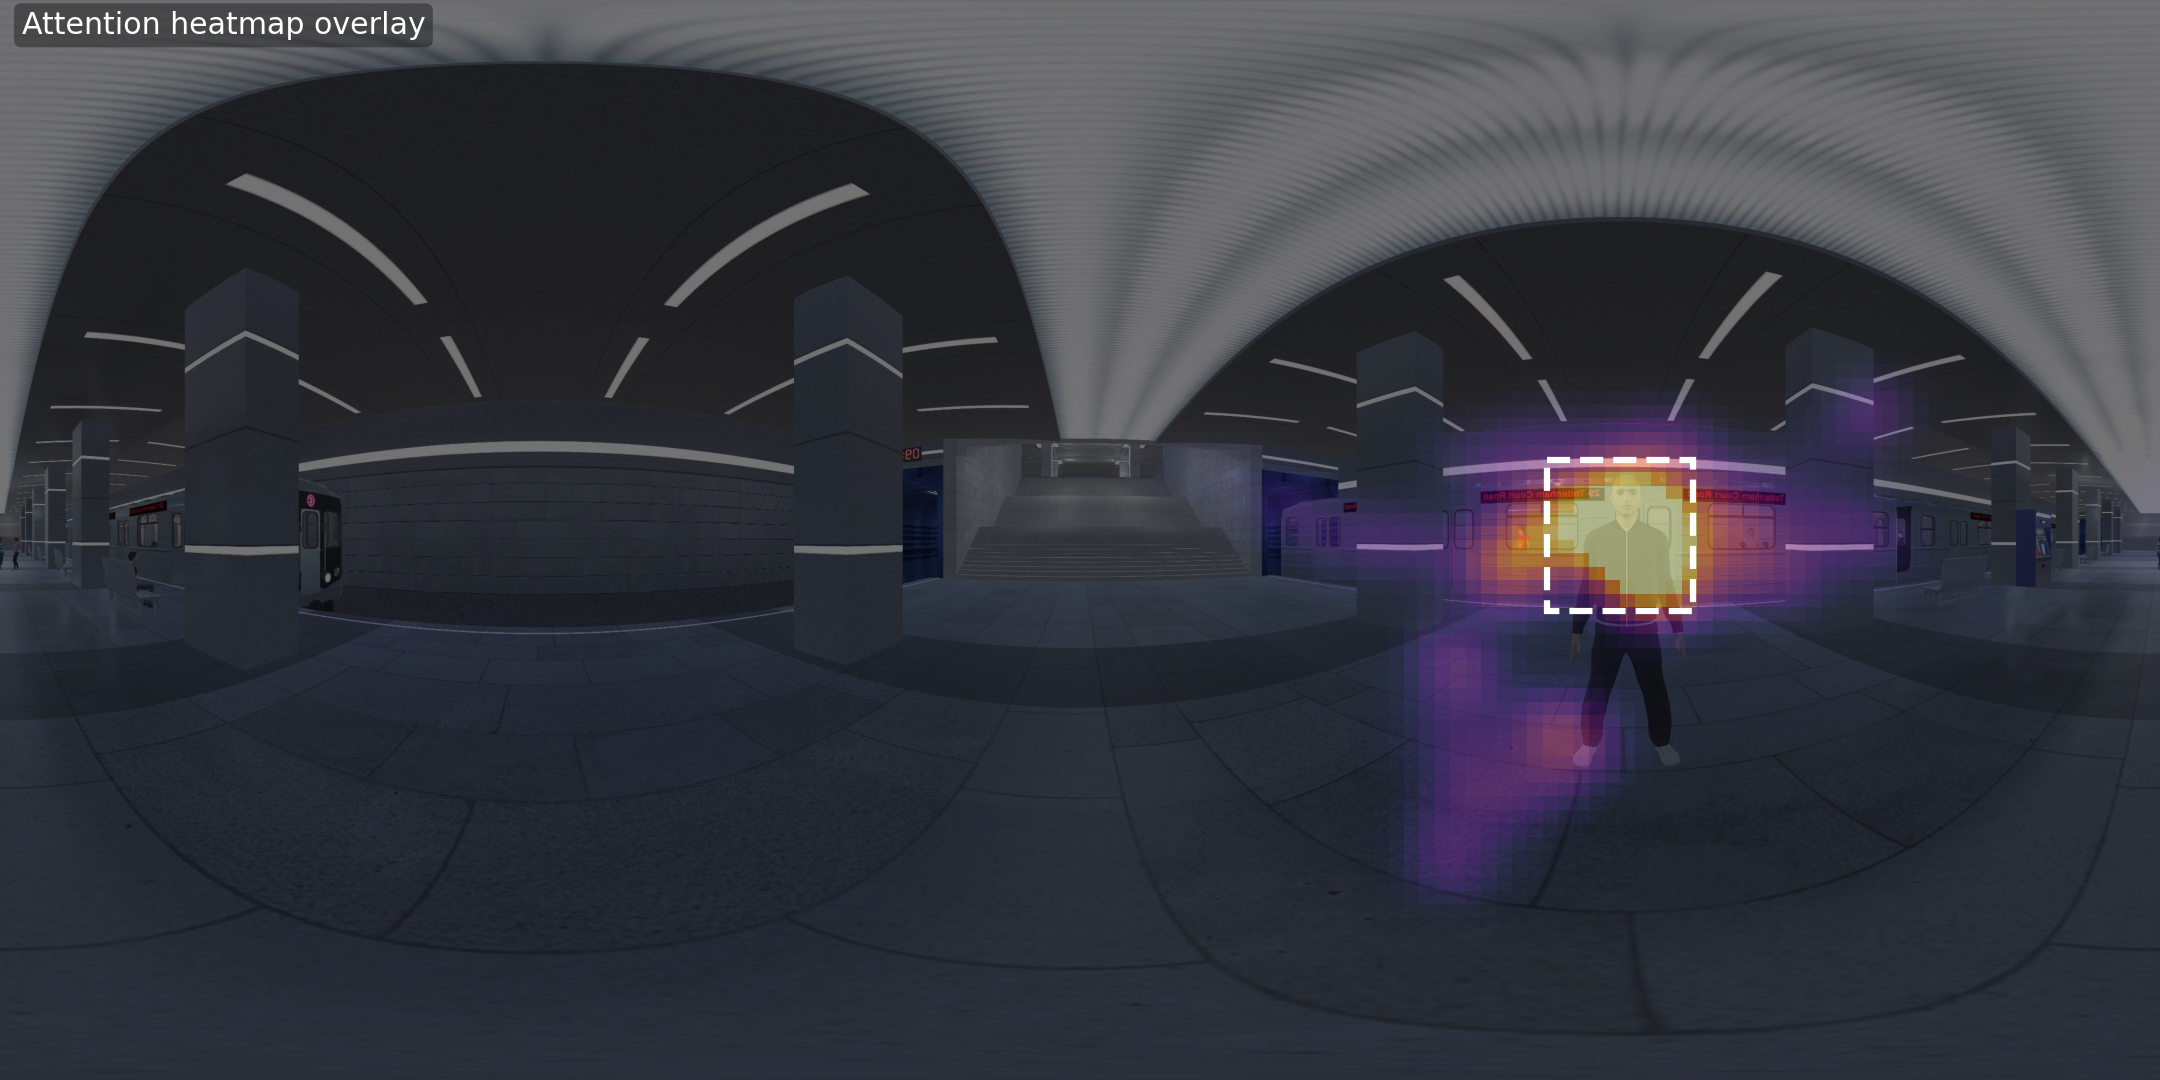