Virtual Reality Attention Tasks in Attention Deficit Hyperactivity Disorder: I. Behavioural Responses

Article Full-text available CC BY 4.0

Virtual Reality Attention Tasks in Attention Deficit Hyperactivity Disorder: I. Behavioural Responses

FK
Fjorda Kazazi
University College London
PH
Peter Howell
University College London

Abstract

Differences in executive functioning associated with working memory and different components of attention including sustained, selective, divided and attentional switching have been reported in people with attention deficit hyperactivity disorder. Traditional laboratory tasks have limited ecological validity, whereas existing virtual reality studies have focused mainly on sustained attention, with multi-attention-form assessment remaining relatively unexplored. Sixty-four participants (34 people with self-reported attention deficit hyperactivity traits and 30 neurotypical participants) were included. Participants were tested for stuttering, attention deficit hyperactivity disorder traits and phonological working memory and then completed 10 virtual reality tasks that measured all four forms of attention. The self-reported attention deficit hyperactivity disorder group showed significantly lower attention scores, higher stuttering scores and lower phonological working memory scores. Behavioural results from the virtual reality tasks revealed that this group differed in sustained attention. Lower accuracy, higher omission error rates and reduced sensitivity occurred in this group in the traditionally formatted task based on the continuous performance test (Task 2). Logistic regression showed that all measures, except for sensitivity in Task 2, significantly predicted group membership. Results from the questionnaires indicated that overall, all participants felt present and immersed in the tasks. Findings suggest that attentional differences are form-specific and mostly observed under sustained attention tasks. Virtual reality can be used as an ecologically valid tool for detecting form-specific attentional differences under real-life scenarios.

Key Findings

Group differences in traits and working memory

Participants with self-reported ADHD traits showed significantly lower attention scores, higher stuttering scores, and lower phonological working memory scores compared with neurotypical controls before VR testing.

Form-specific sustained attention deficits

Behavioural VR results indicated that ADHD-trait differences were most pronounced in sustained attention. Task 2 (continuous performance test format) showed lower accuracy, higher omission errors, and reduced sensitivity in the ADHD-trait group.

Ecological validity and immersion

Logistic regression showed that nearly all behavioural measures predicted group membership. Questionnaire responses indicated that participants across groups felt present and immersed in the VR scenarios, supporting VR as an ecologically valid assessment tool.

Figures

Published figures from the open-access article on Wiley Online Library (CC BY 4.0).
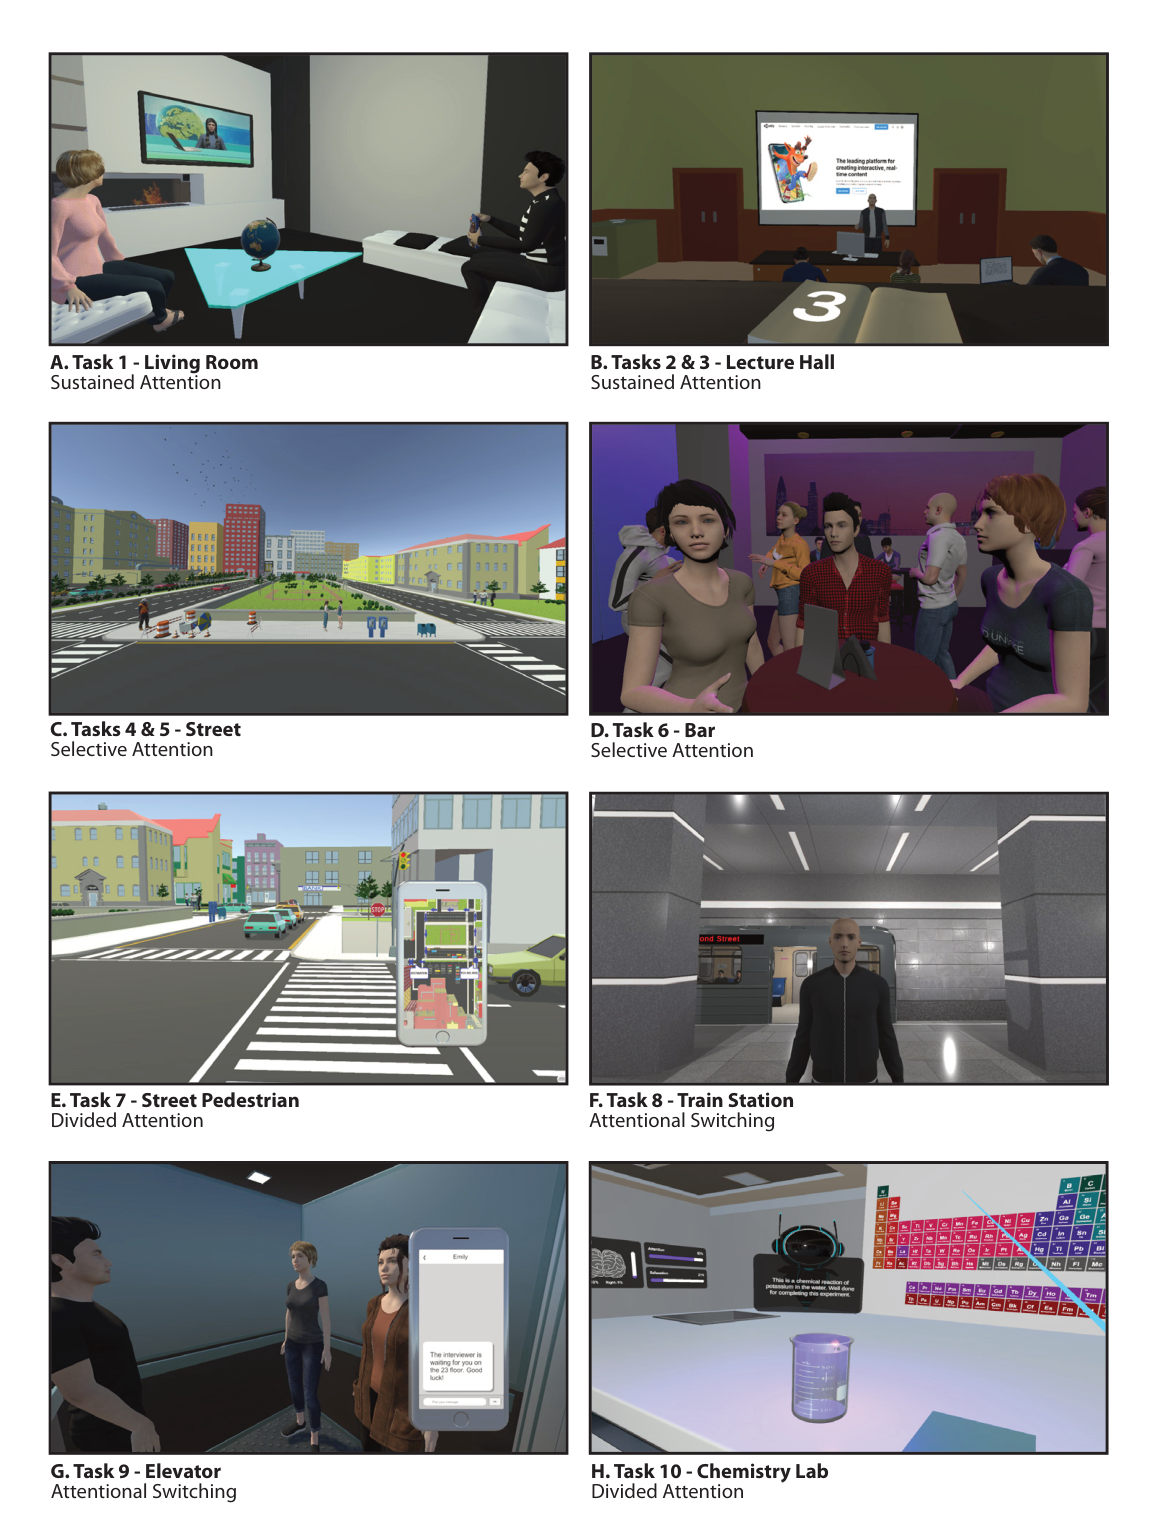
Figure 1.

Click image to enlarge

Figure 1. VR tasks utilised in the current study. (A) Task 1—Living room measured sustained attention; (B) Tasks 2 and 3—Lecture hall measured sustained attention (CPT/TFT and SART); (C) Tasks 4 and 5—Street measured selective attention; (D) Task 6—Bar measured selective attention; (E) Task 7—Street pedestrian assessed divided attention; (F) Task 8—Train station assessed attentional switching; (G) Task 9—Elevator measured attentional switching; and (H) Task 10—Chemistry lab measured divided attention. Tasks 2–3 and Tasks 4–5 used the same environments.
Figure 2.
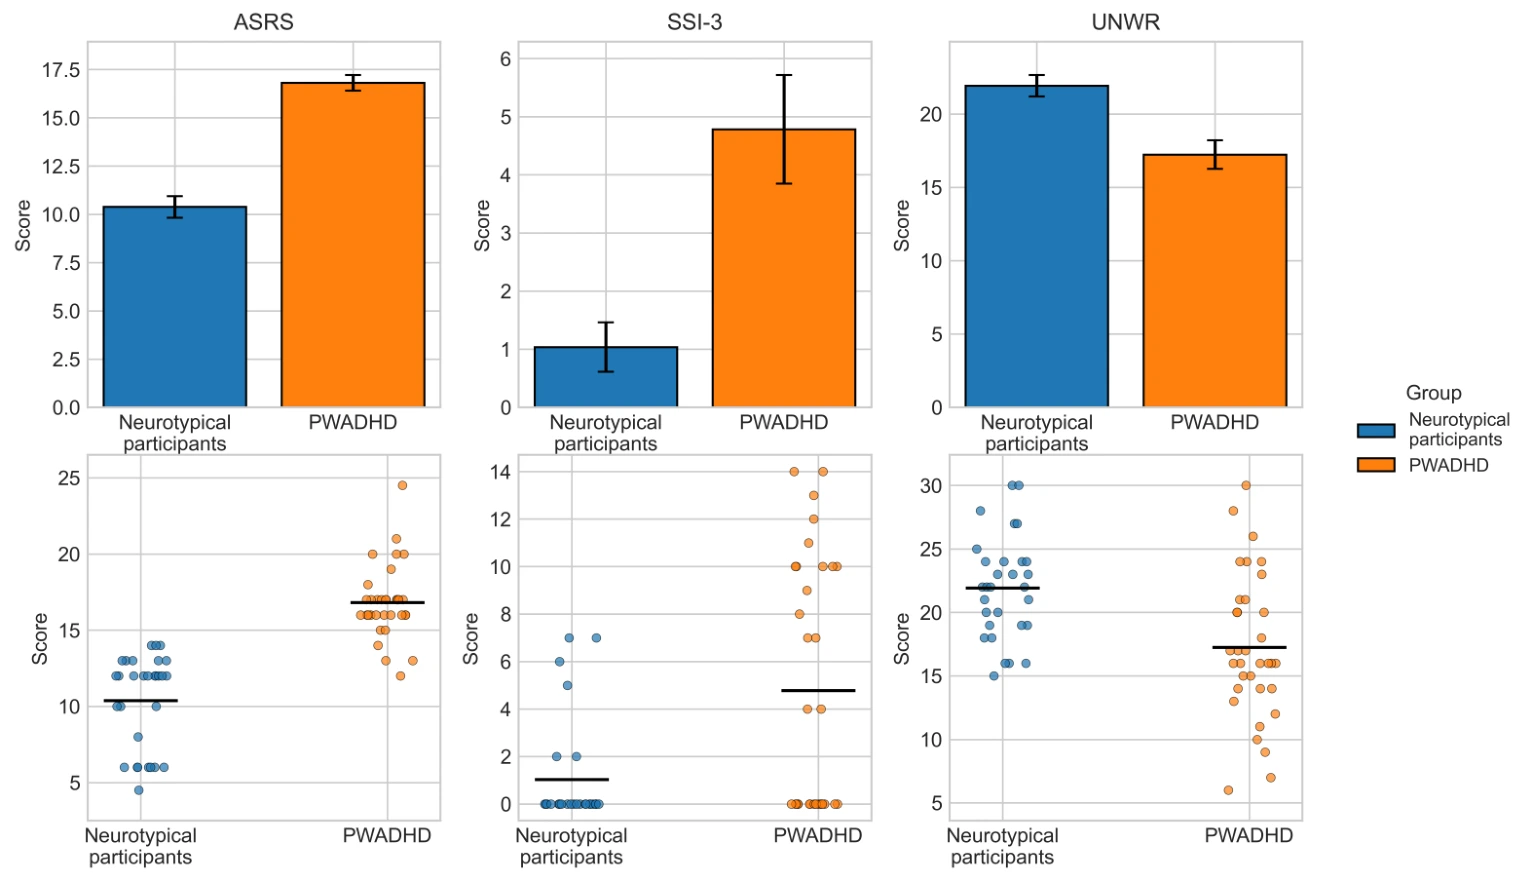
Figure 2. Top row representing bar graphs visualising group differences on ASRS, SSI-3 and UNWR scores. Error bars represent ±SEM. The bottom row shows individual participant scores on ASRS, SSI-3 and UNWR, with horizontal lines indicating group means.
Figure 3.
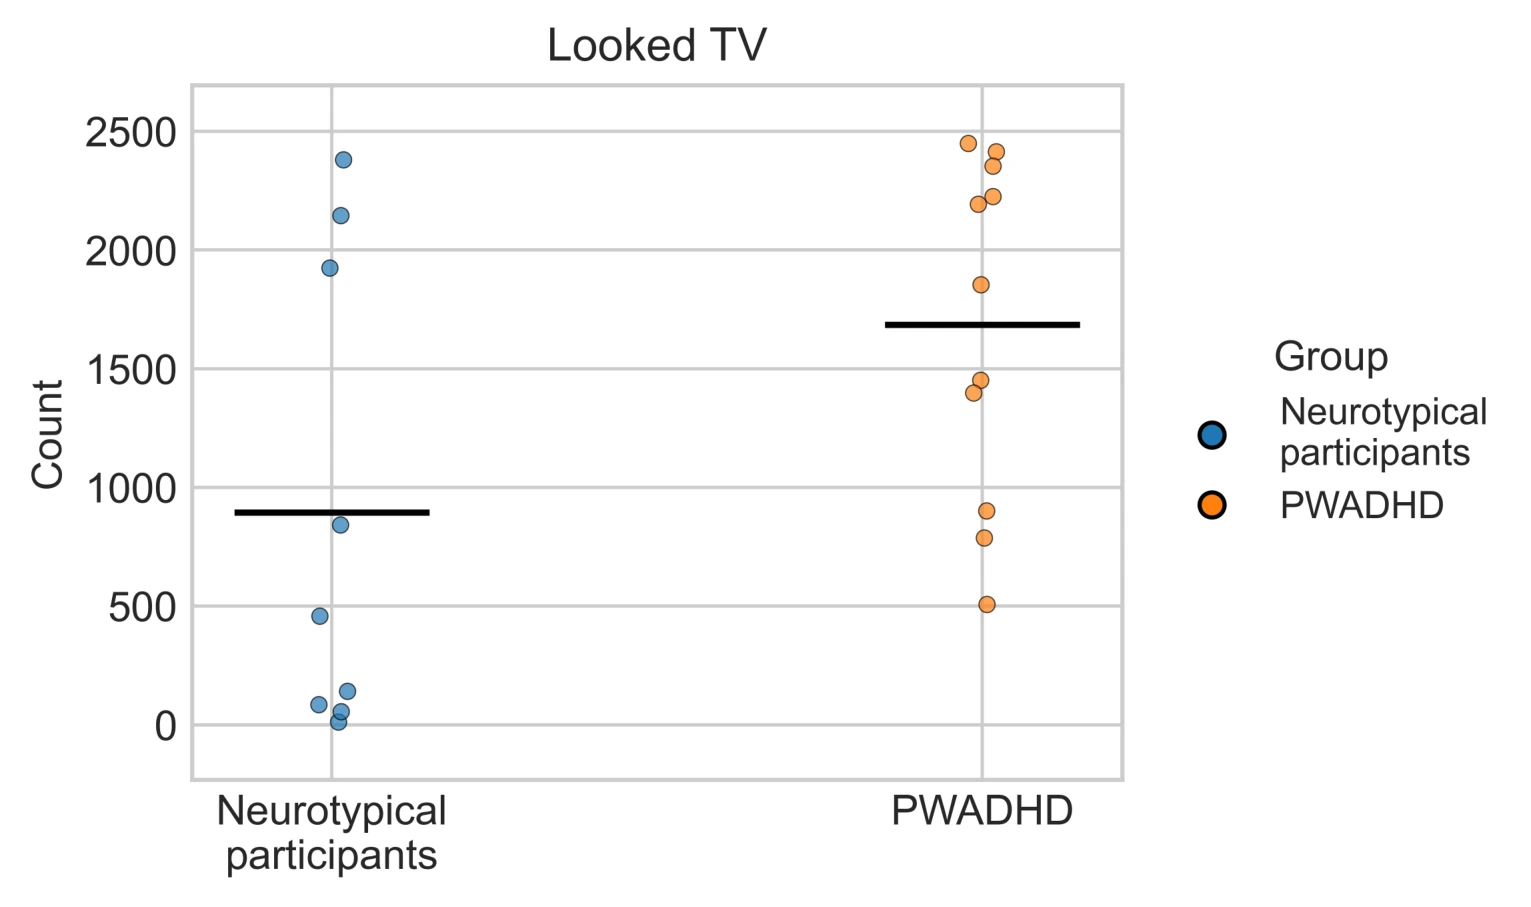
Figure 3. Dot plots visualising group differences in attention frequency (looked TV count) in Task 1. Points represent individual participants. Horizontal lines indicate group means.
Figure 4.
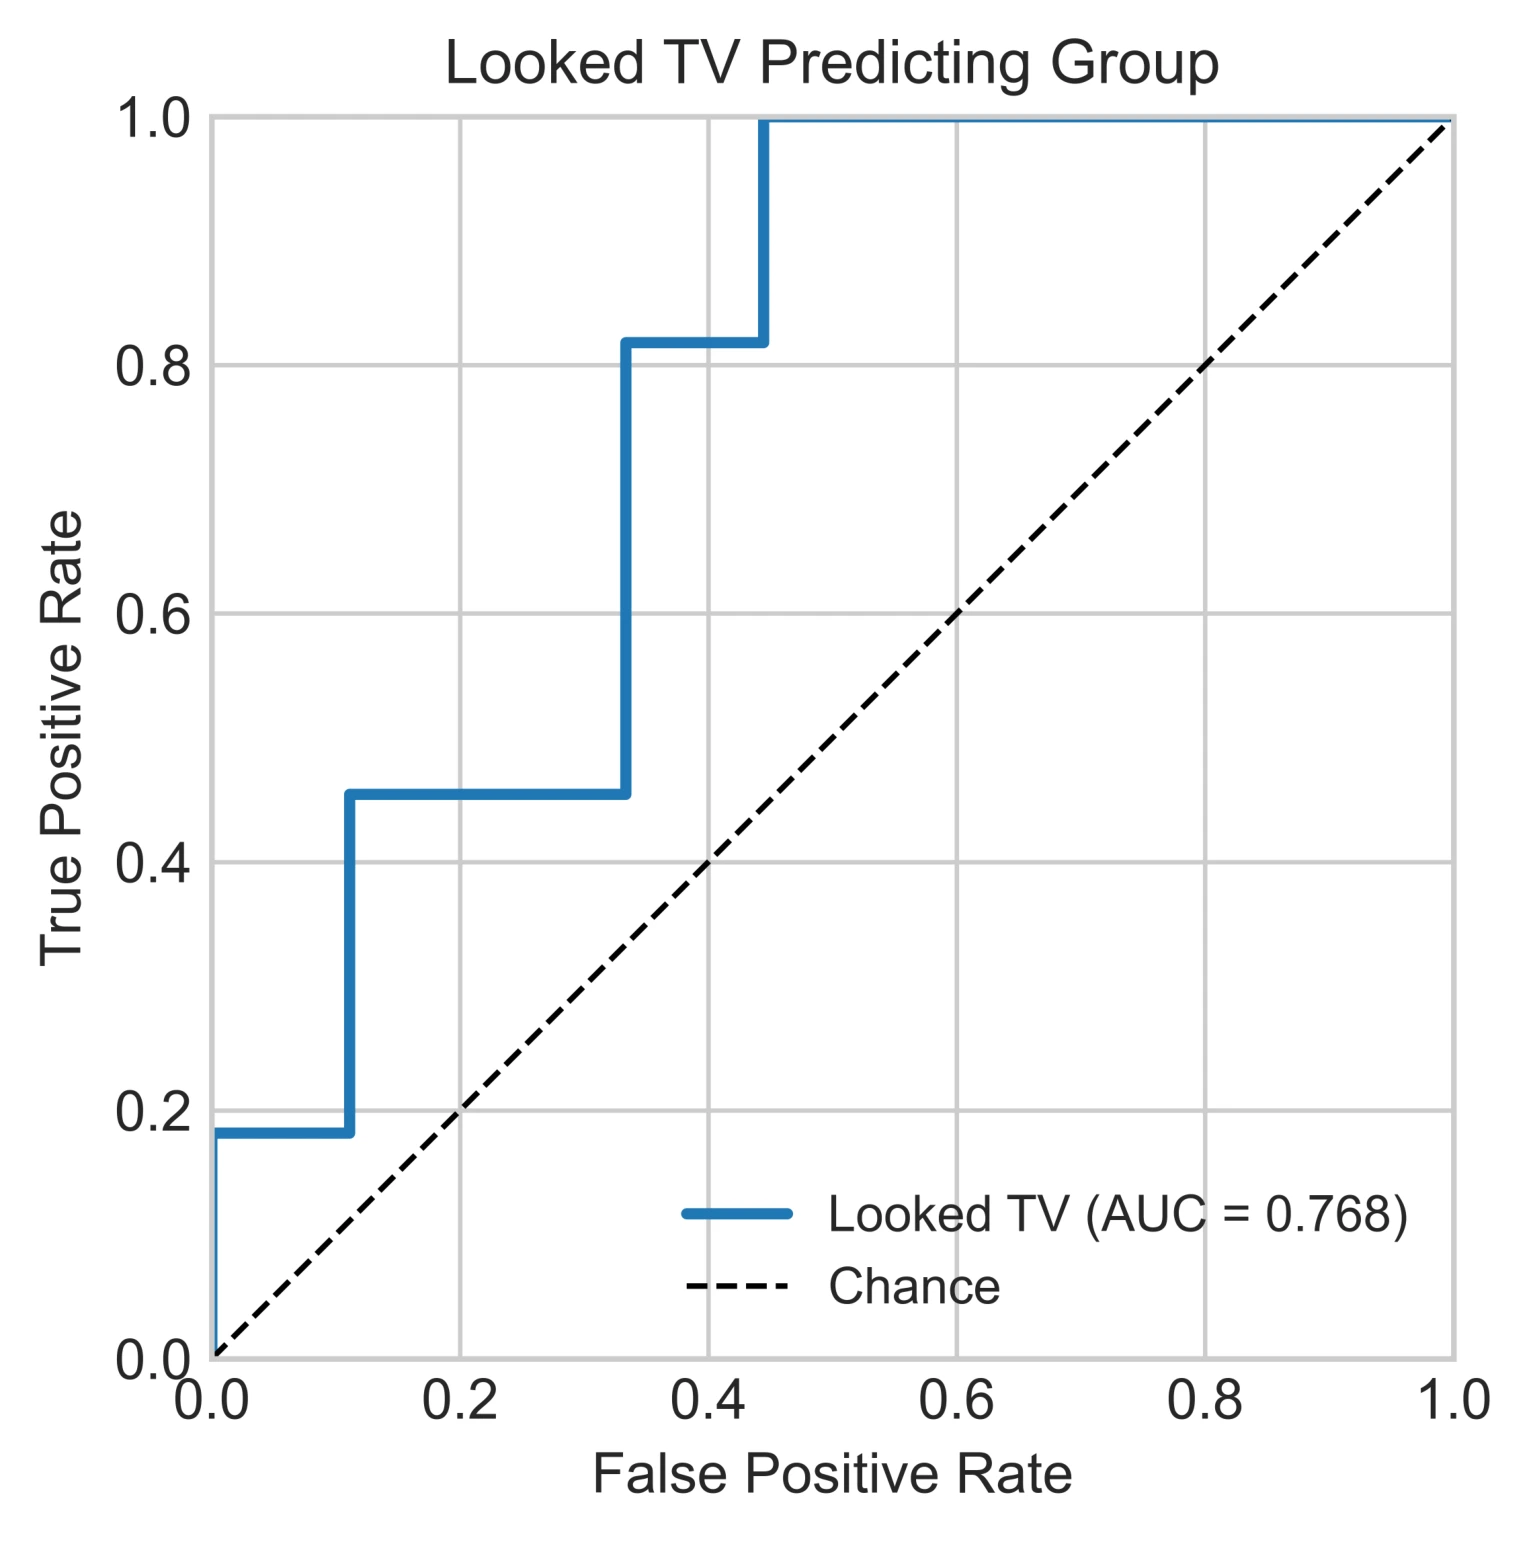
Figure 4. Receiver operating characteristic (ROC) curve for Task 1 looked TV count predicting group membership (neurotypical participants and PWADHD). The diagonal line indicates chance performance (AUC = 0.50).
Figure 5.
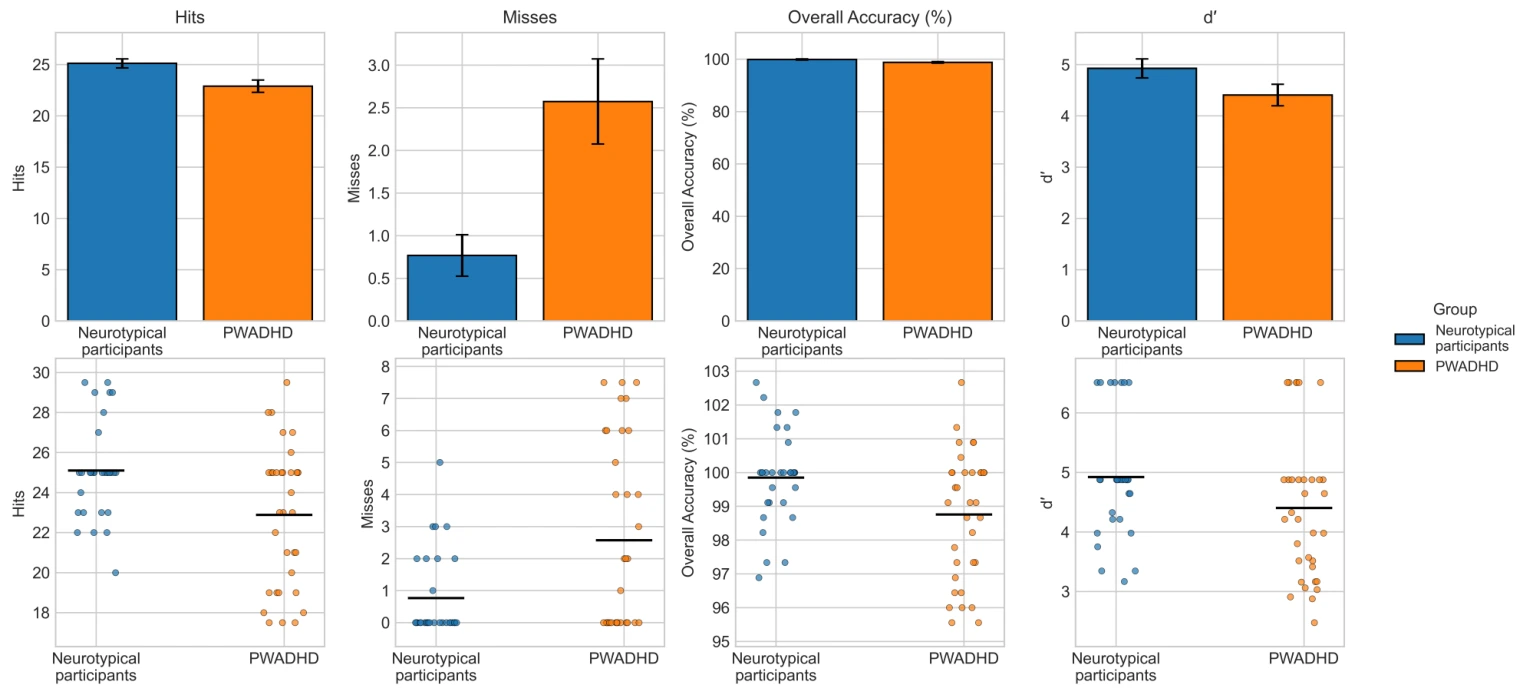
Figure 5. Bar graphs (top row) and participant data points (bottom row) visualising group differences for hits (correct responses), misses (omission errors), overall accuracy % and d′ (sensitivity) in Task 2. Error bars in the top row represent ±SEM, and horizontal lines in the bottom row represent group means.
Figure 6.
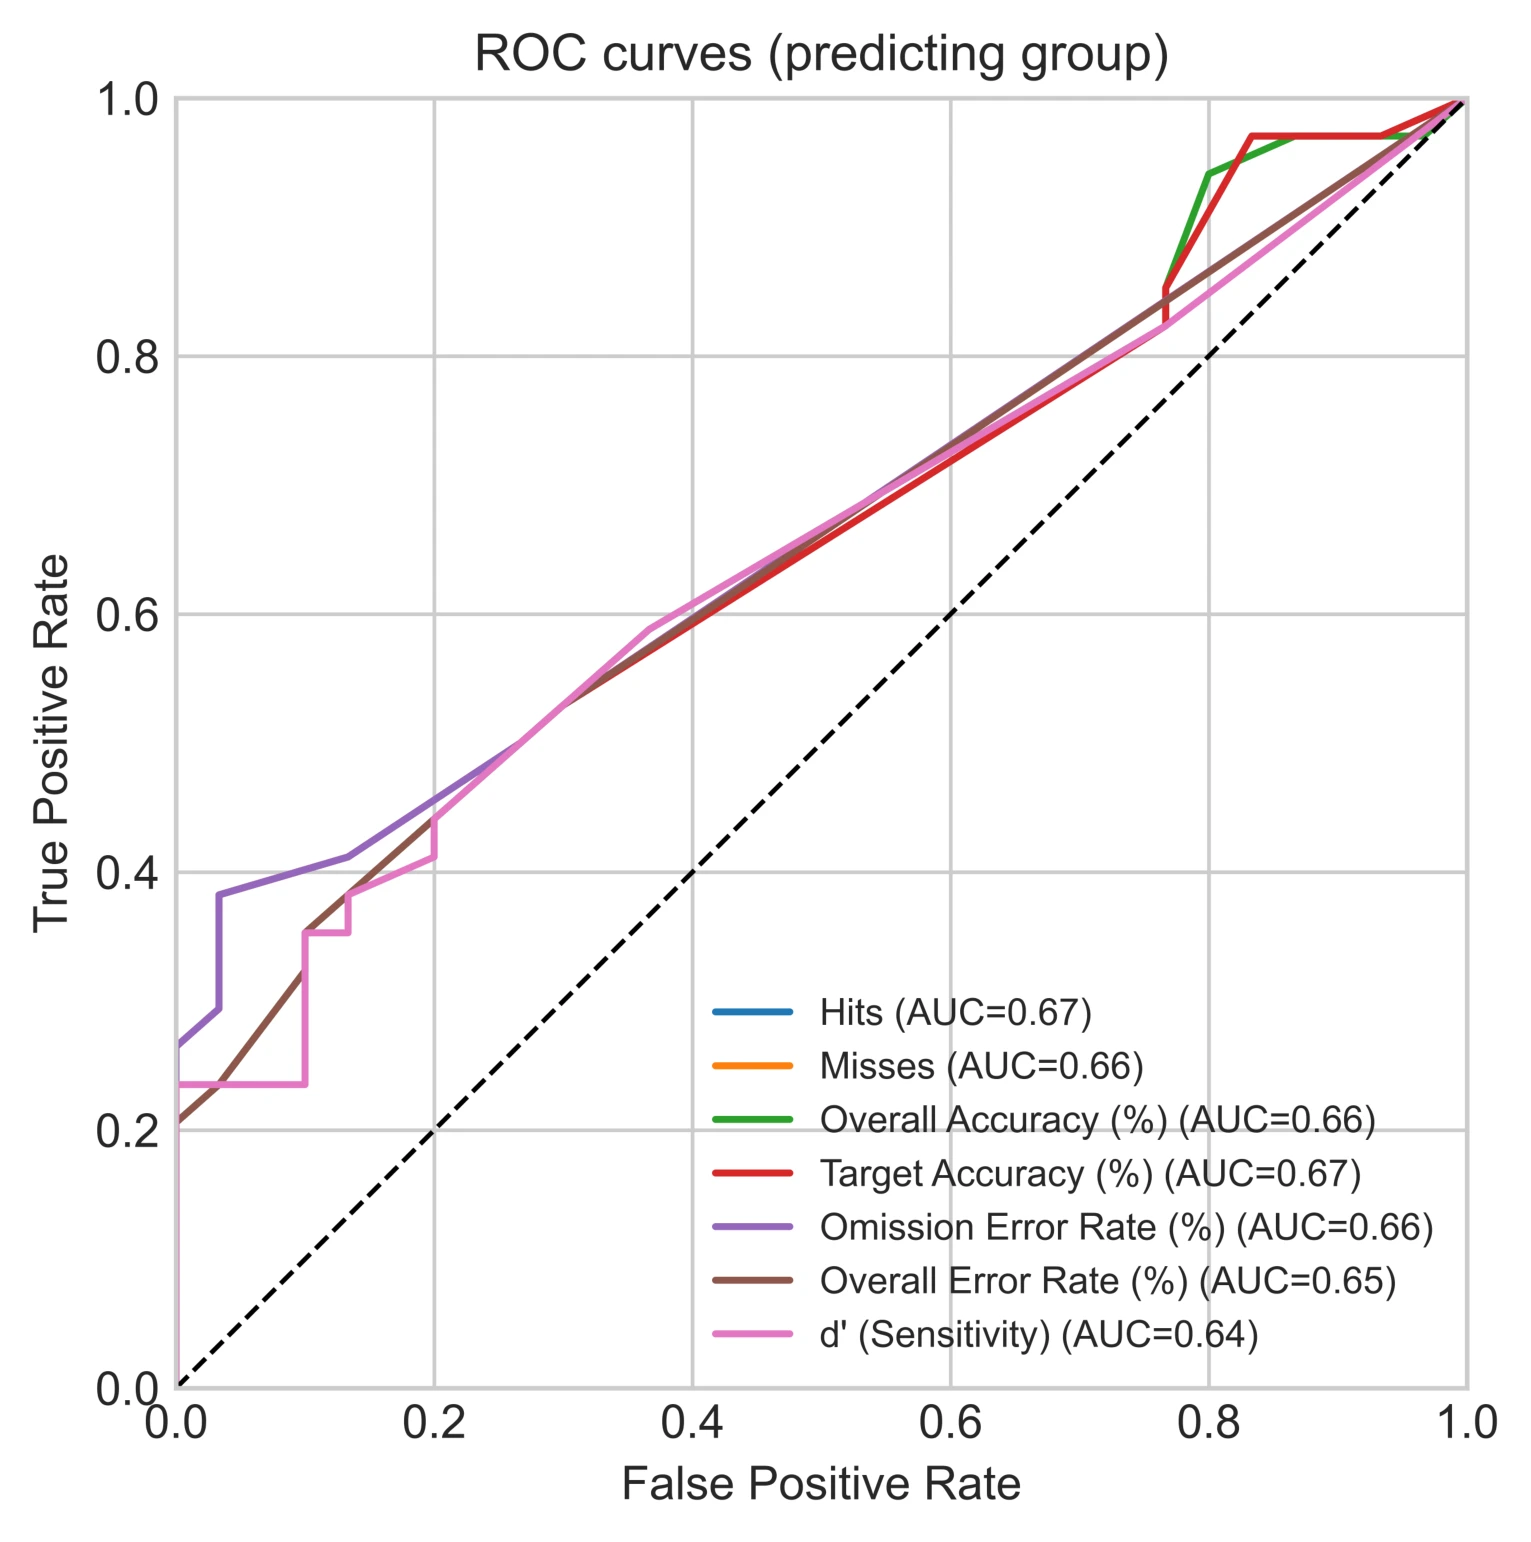
Figure 6. Receiver operating characteristic (ROC) curve for Task 2 hits (correct responses), misses (omission errors), overall accuracy %, target accuracy %, omission error rate %, overall error rate % and d′ (sensitivity) predicting group membership (neurotypical participants and PWADHD). The diagonal line indicates chance performance (AUC = 0.50).
Figure 7.
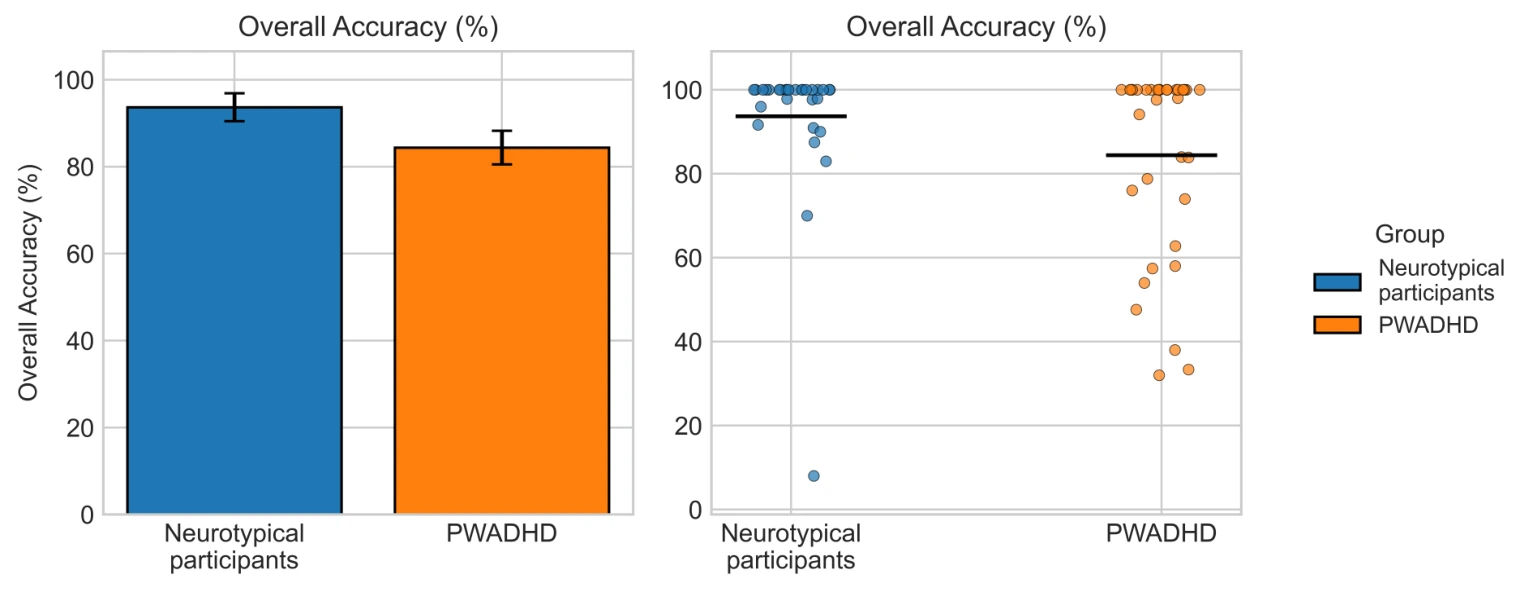
Figure 7. Bar graphs (left plot) and participant data points (right plot) visualising group differences for overall accuracy (%) in Task 5. Error bars represent ±SEM, and horizontal lines represent group means.
Figure 8.
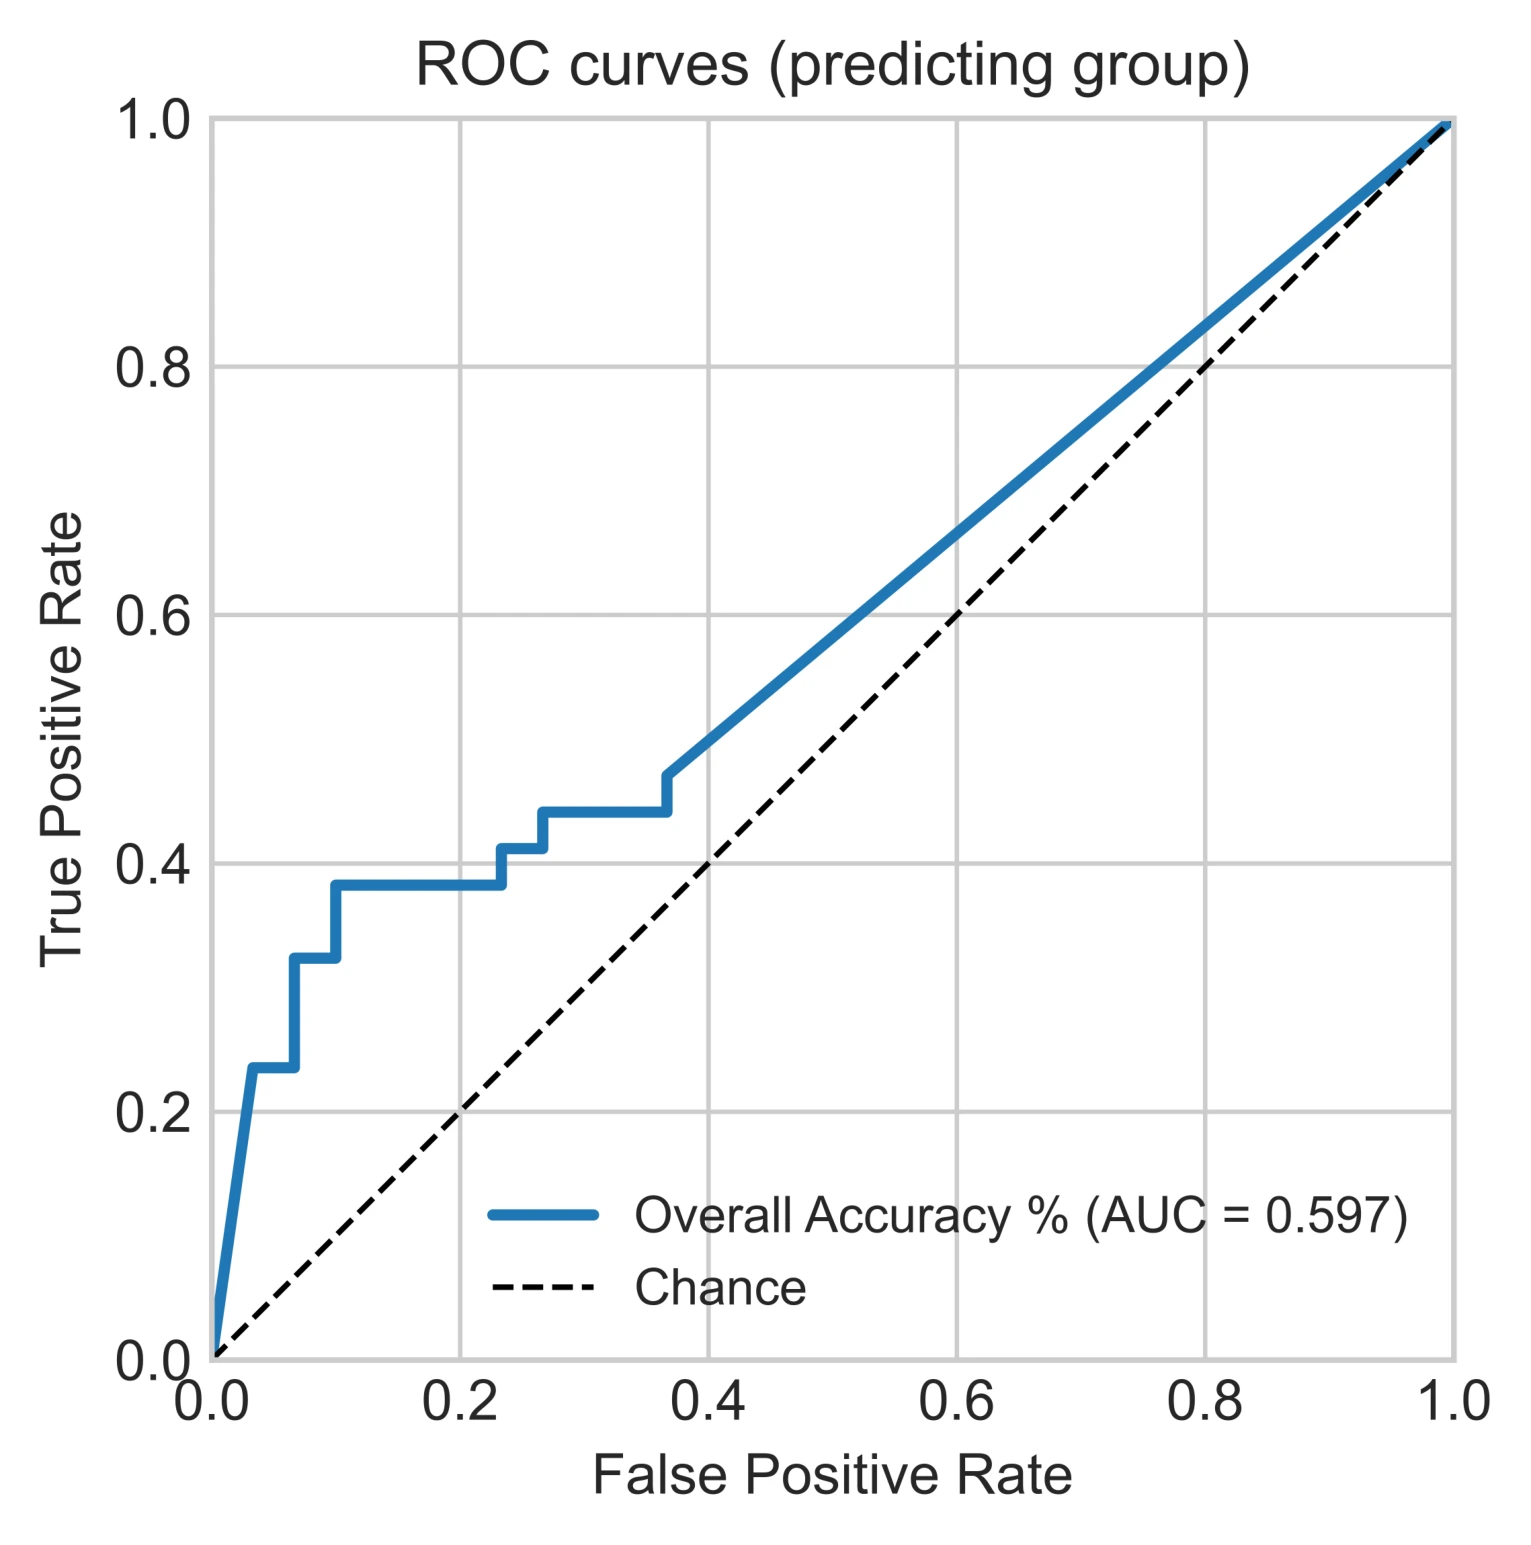
Figure 8. Receiver operating characteristic (ROC) curve for Task 5 overall accuracy predicting group membership (neurotypical participants and PWADHD). The diagonal line indicates chance performance (AUC = 0.50).
Figure 9.
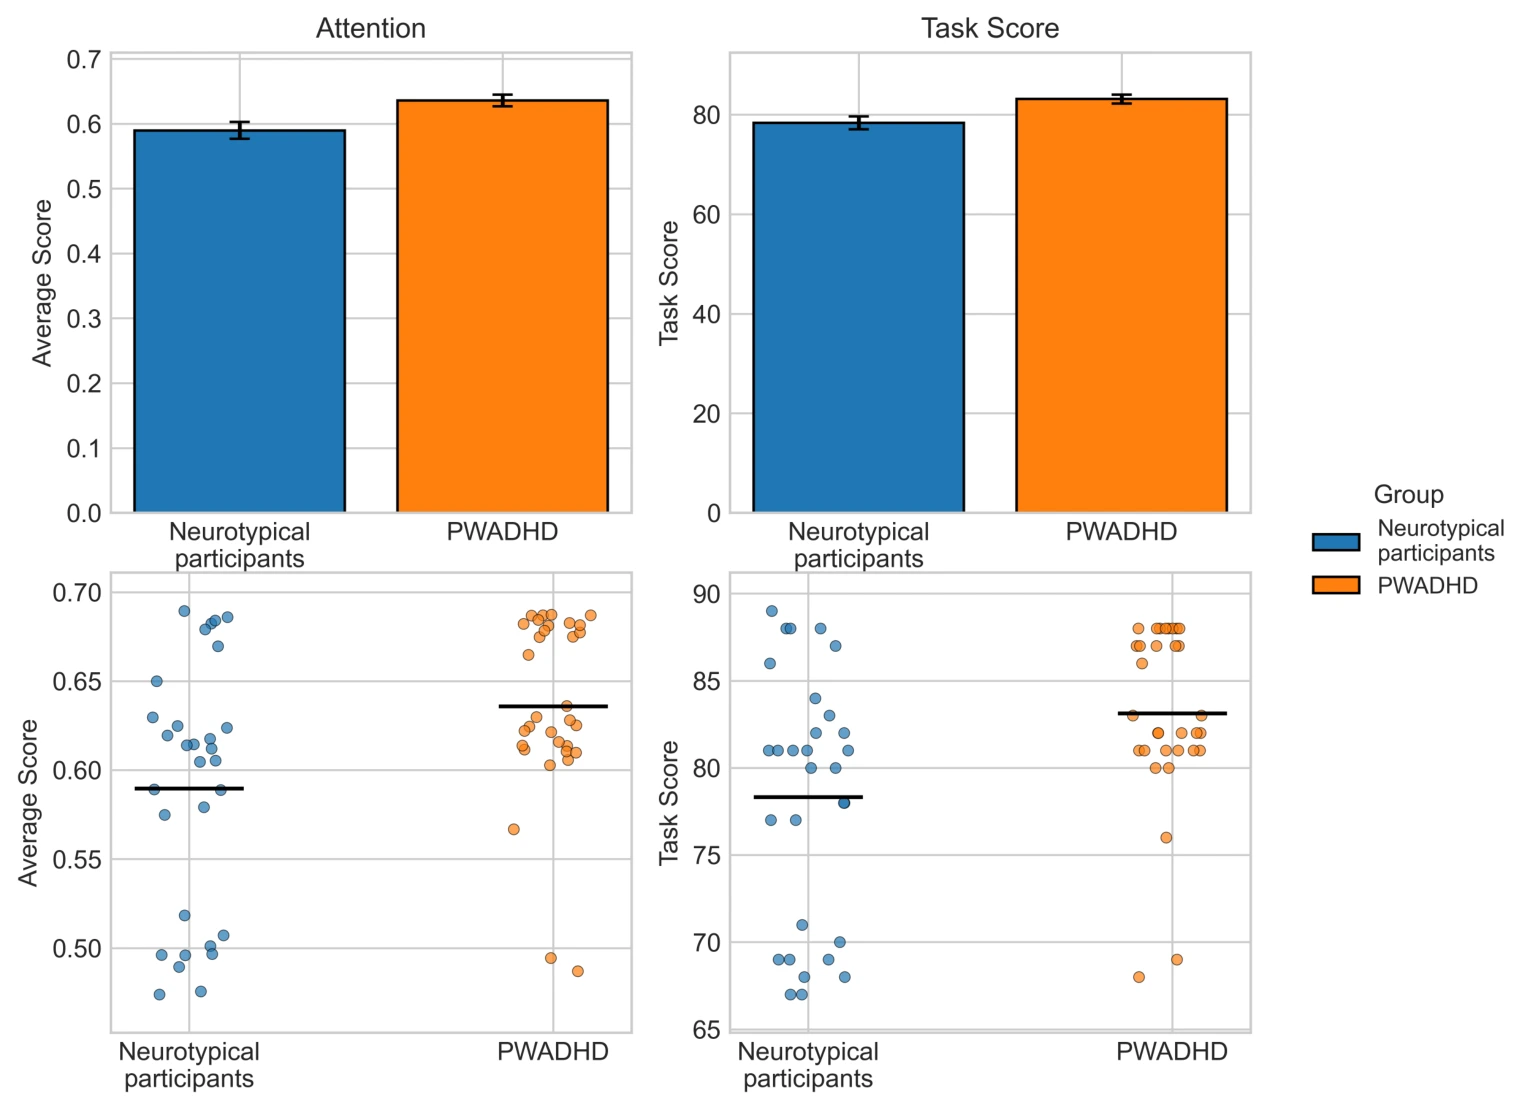
Figure 9. Bar graphs (top row) visualising group differences for attention (average) and score in Task 10. Scatter plot (bottom row) visualising participant data points for the same variables. Error bars represent ±SEM, and horizontal lines represent group means.

Publication Details

Journal
European Journal of Neuroscience
Published
September 2026 · Volume 64, Issue 6
License
Creative Commons CC BY 4.0
Sample
N = 64 (30 neurotypical, 34 self-reported ADHD traits)
Design
10 VR attention tasks · Saccade & antisaccade · CPT-format Task 2

Links

Suggested Citation

Kazazi, F., & Howell, P. (2026). Virtual Reality Attention Tasks in Attention Deficit Hyperactivity Disorder: I. Behavioural Responses. European Journal of Neuroscience, 64(6). https://doi.org/10.1111/ejn.70691